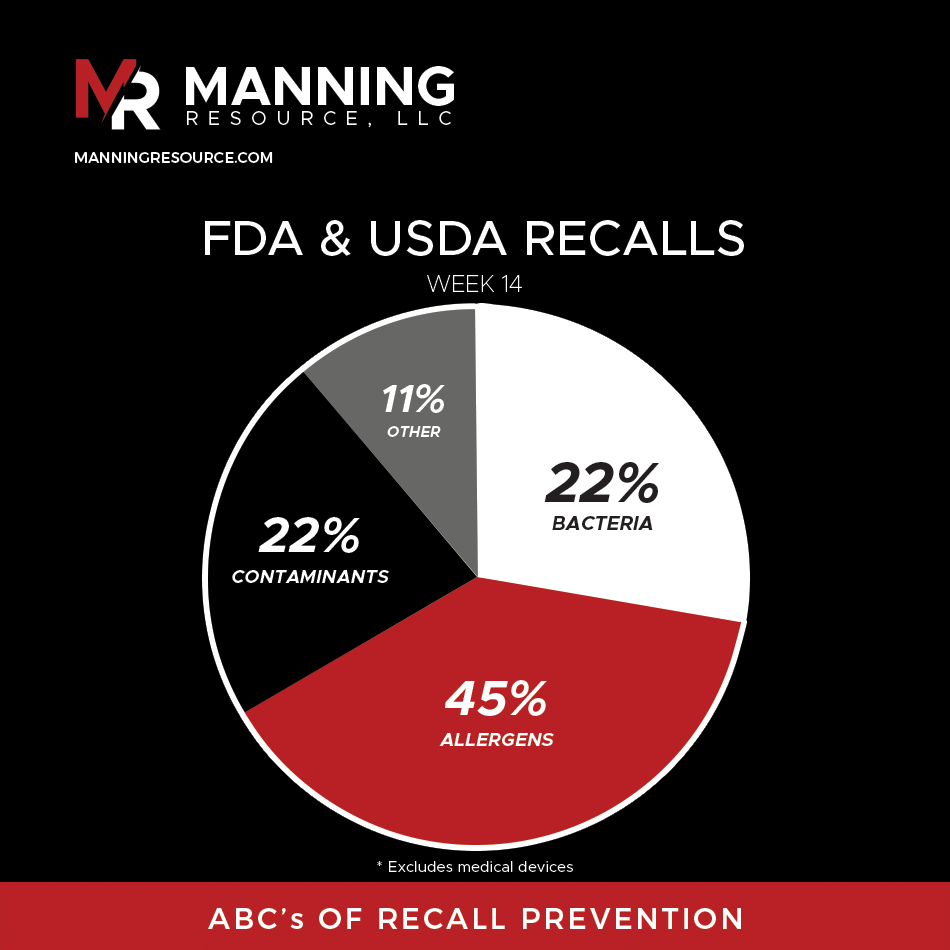
In Week 14, allergens accounted for 45% of FDA and USDA class 1 recalls, more than bacteria and contaminants combined, each at 22%. This data highlights a persistent challenge in
We Think About Risks with Ingredients, But When Was the Last Time We Proactively Thought About Water? In food and beverage manufacturing, we obsess over ingredient sourcing, formulation precision, and
Missing Information = Major Risks One overlooked label, one missing instruction, that’s all it takes to trigger a Class 1 recall and put consumers at risk. Whether it’s undeclared allergens
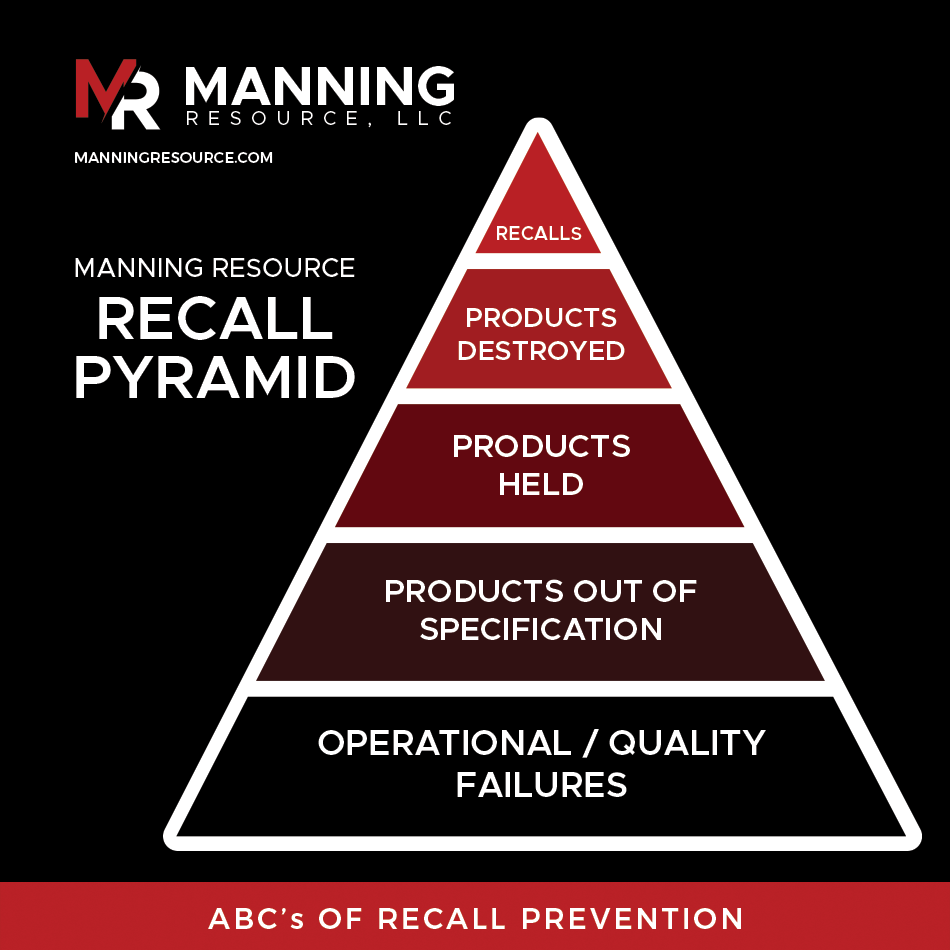
The ABC’s of Recall Prevention: Allergens, Bacteria, and Contaminants FDA Class 1 Recalls aren’t random—they follow a pattern: – 25% from Undeclared Allergens – Mislabeling or cross-contact can lead to
The recent recalls highlight the critical role of GMP compliance, particularly in handwashing and shoe sanitation, to prevent cross-contamination. Proper hygiene practices could mitigate risks associated with bird flu in
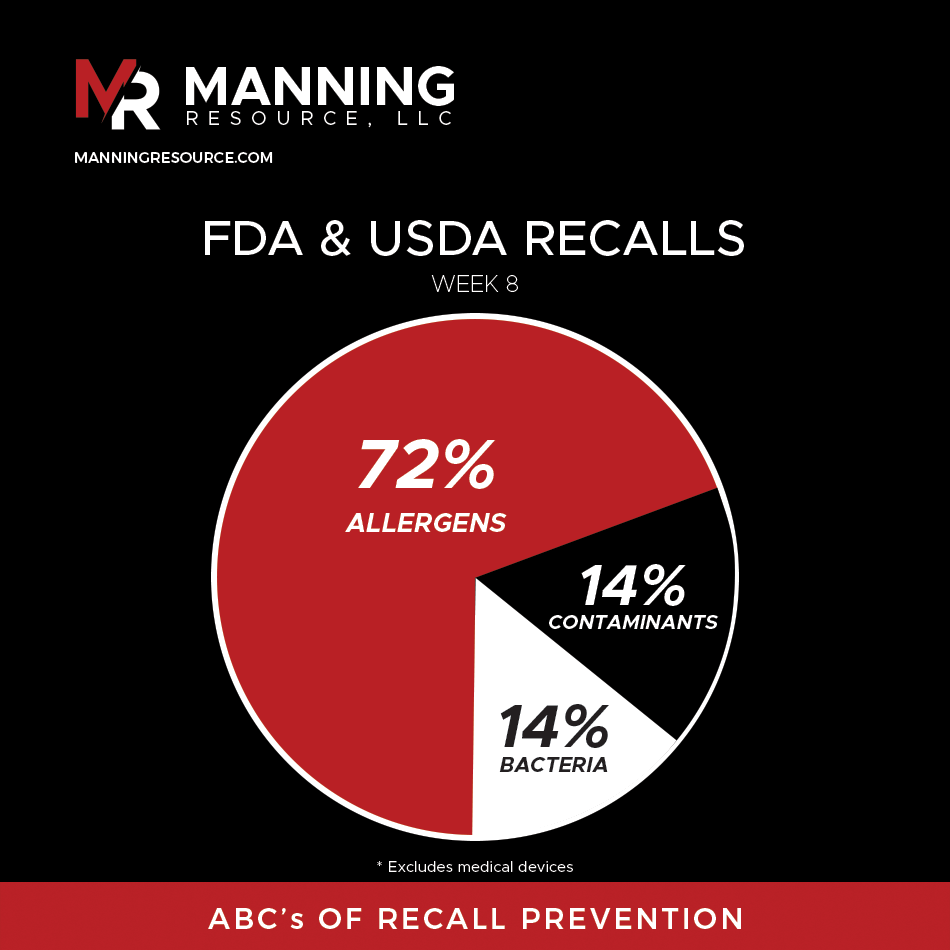
Week 8 Recall Overview (Feb 16 – Feb 23, 2025) Seven recalls were issued in the food and beverage sector, six by the FDA and one by USDA. Issues ranged
Recent Food & Beverage Recalls: What You Need to Know Food safety remains a top priority for manufacturers, regulators, and consumers alike. In the past week, multiple recalls have been
Last Week’s Recalls: A Bacterial Pattern Emerges All Class 1 food recalls had one thing in common—bacterial contamination. – 2/8/25 – Alfalfa Sprouts – Listeria monocytogenes Routine testing in Minnesota
In the world of food and beverage manufacturing, recalls are the ultimate nightmare. They damage reputations, erode consumer trust, and lead to significant financial losses. But recalls don’t just happen
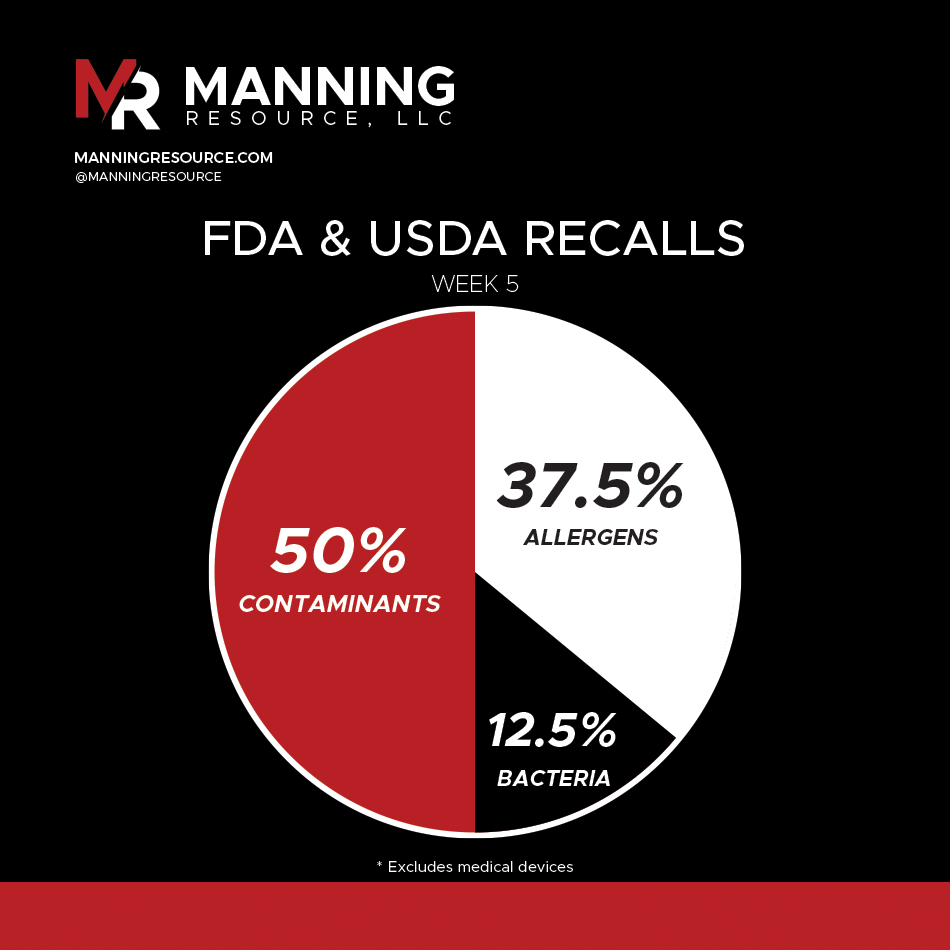
Week 5 FDA & USDA Recalls: Key Insights Breakdown of Recalls 🔴 50% Contaminants – Foreign materials and lead contamination. ⚪ 37.5% Allergens – Undeclared milk and sesame in various