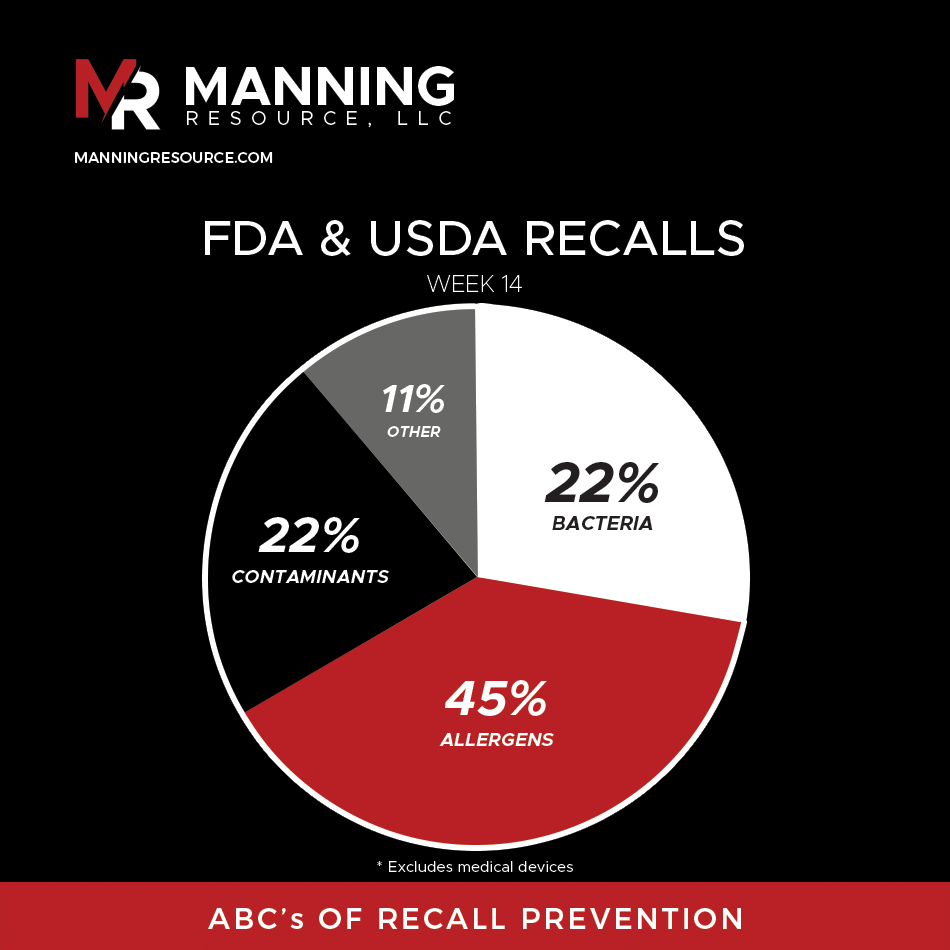
In Week 14, allergens accounted for 45% of FDA and USDA class 1 recalls, more than bacteria and contaminants combined, each at 22%. This data highlights a persistent challenge in
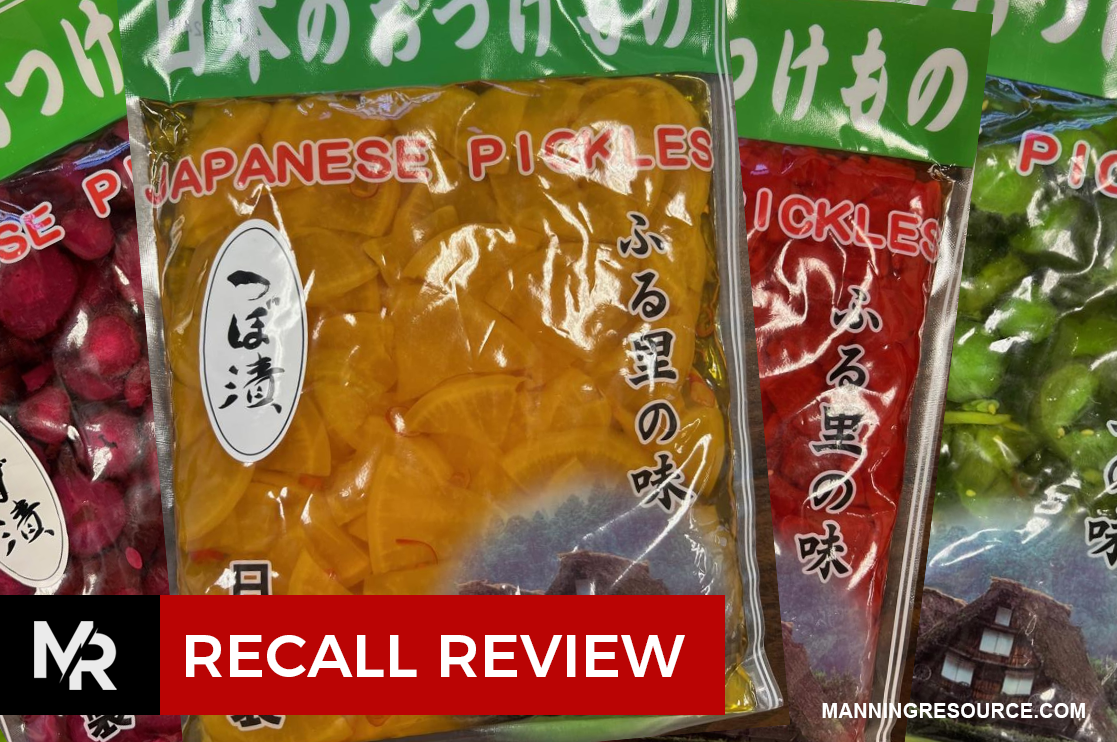
Current Class 1 FDA & USDA Recall Trends FDA Recalls / Reason(s) 4/3/25 – Food & Beverage – Condiments – Potential or Undeclared Allergen-Sulfites. “The firm discovered during an internal
Current Class 1 FDA & USDA Recall Trends FDA Recalls / Reason(s) 3/28/25 – Food & Beverage – Brioche loaves, Brioche Buns – May contain undeclared milk, soy and yellow
Current Class 1 FDA & USDA Recall Trends FDA Recalls / Reason(s) 3/20/25 – Food & Beverage – Favorite Day Gourmet New York Style Cheesecake – Potential or Undeclared Allergen
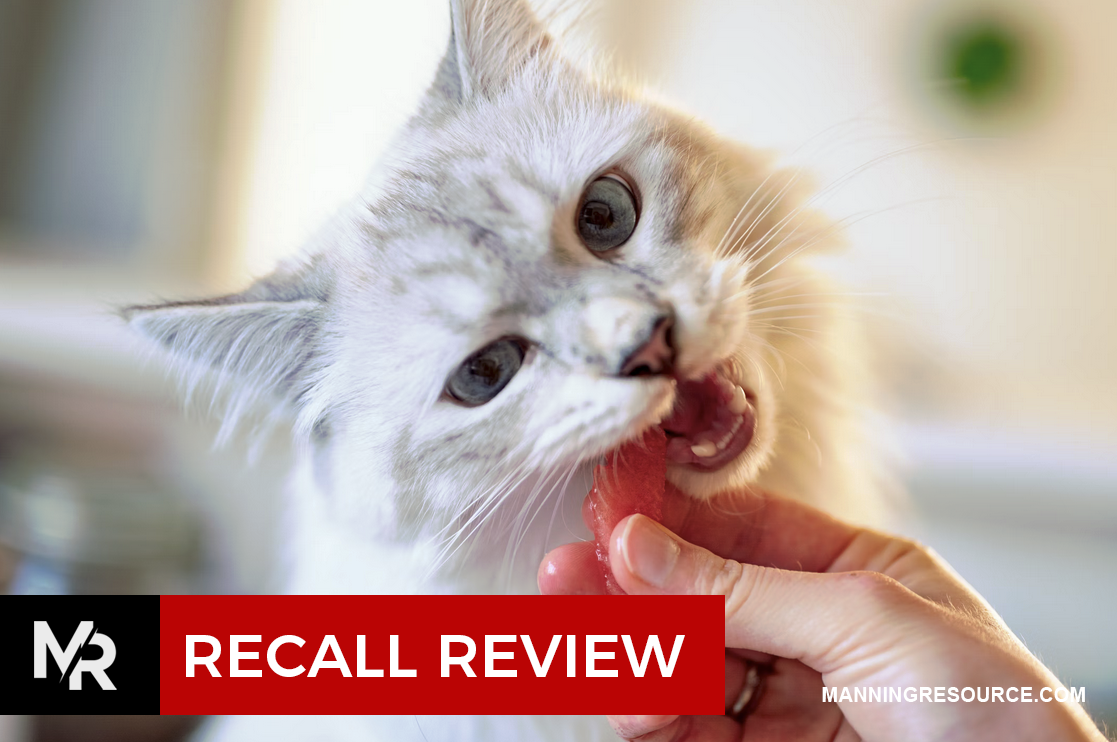
Current Class 1 FDA & USDA Recall Trends FDA Recalls / Reason(s) 3/15/25 – Animal & Veterinary – Cat Food Chicken – Possible Bird Flu Health Risk. “In February, Savage
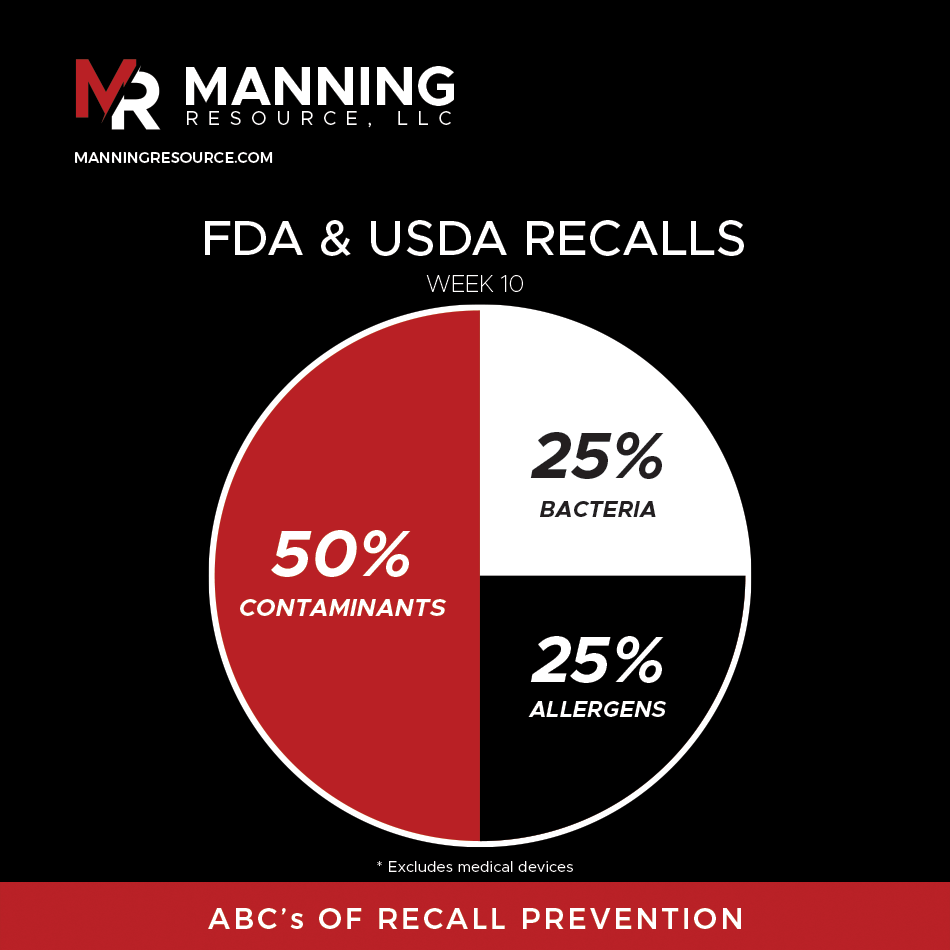
The ABC’s of Recall Prevention: Allergens, Bacteria, and Contaminants FDA Class 1 Recalls aren’t random—they follow a pattern: – 25% from Undeclared Allergens – Mislabeling or cross-contact can lead to
Current Class 1 FDA & USDA Recall Trends FDA Recalls / Reason(s) 3/5/25 – Animal & Veterinary – Cattle Feed – Elevated levels or deficient levels of nutrients which may
Current FDA & USDA Recall Trends FDA Recalls / Reason(s) 3/1/25 – Animal & Veterinary – Frozen Boneless Free Range Chicken Formula raw pet food for cats – Possible Bird
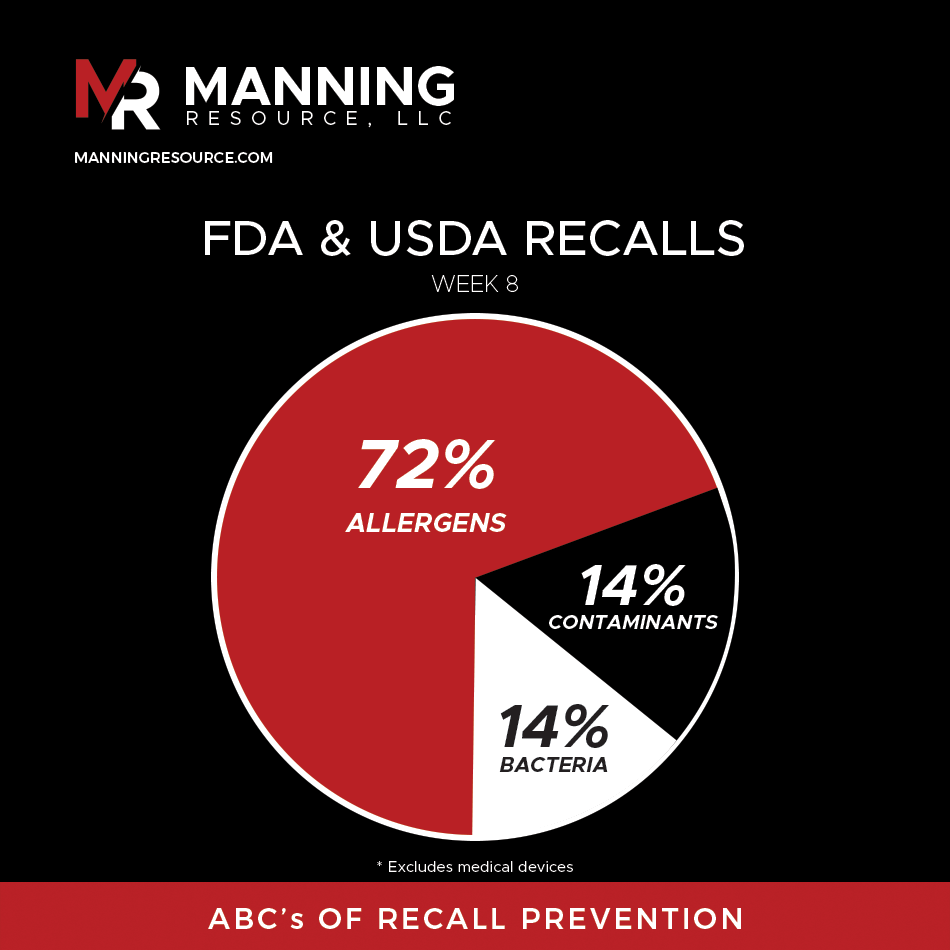
Week 8 Recall Overview (Feb 16 – Feb 23, 2025) Seven recalls were issued in the food and beverage sector, six by the FDA and one by USDA. Issues ranged
Recent Food & Beverage Recalls: What You Need to Know Food safety remains a top priority for manufacturers, regulators, and consumers alike. In the past week, multiple recalls have been